
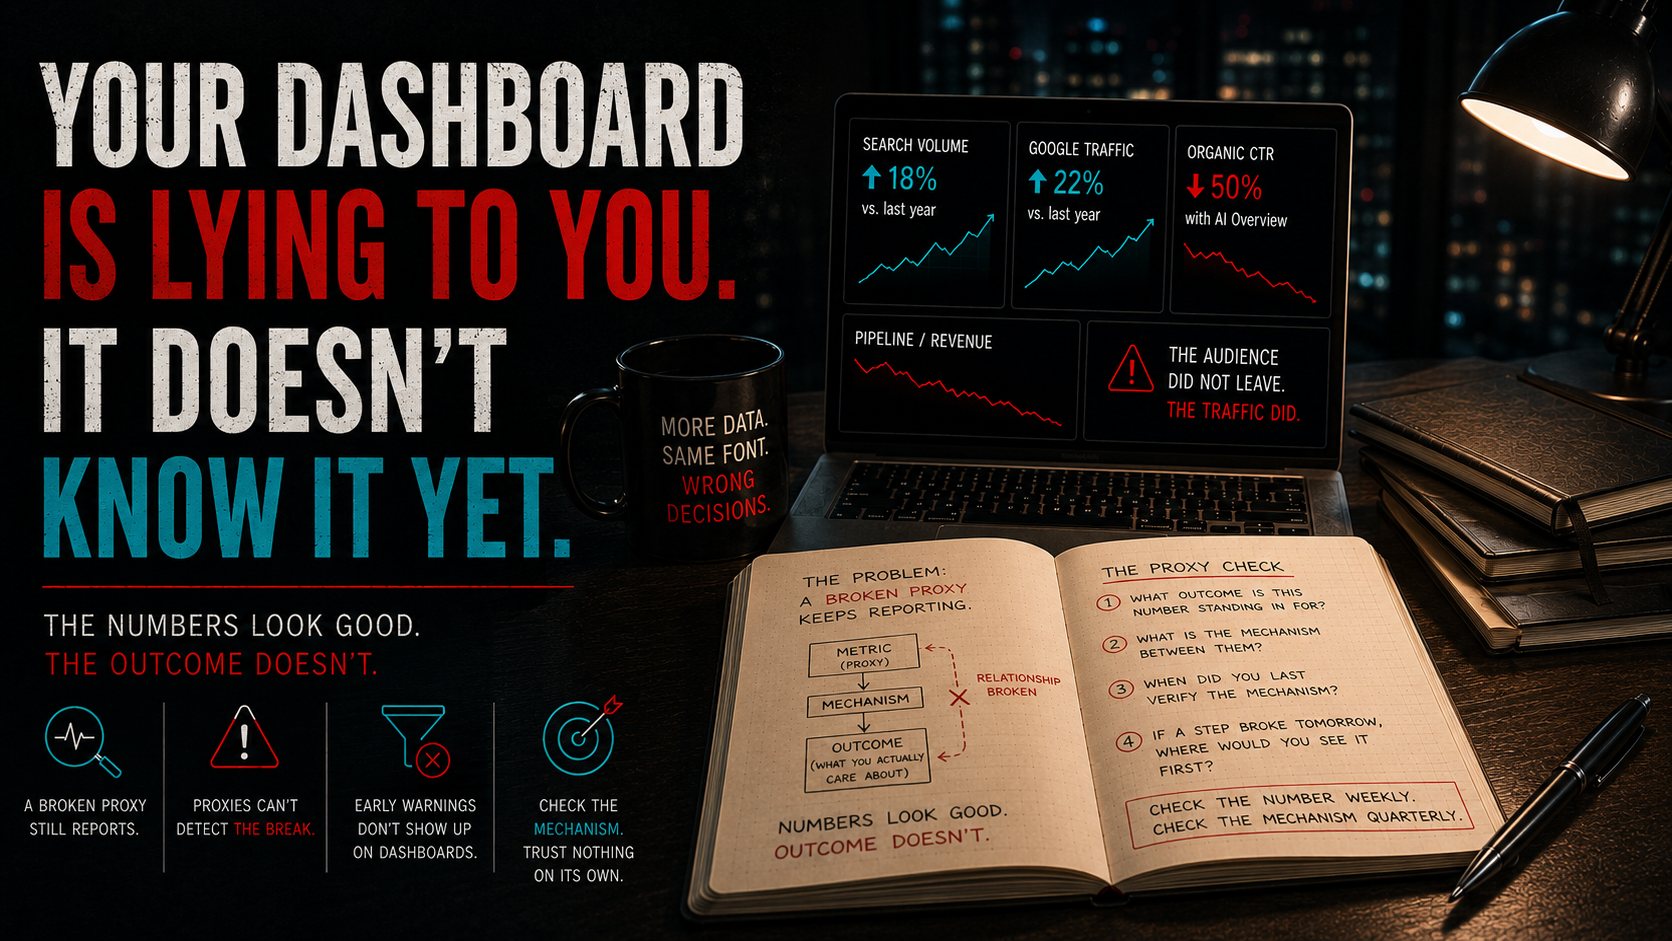
Search volume is up. Google traffic is up. And the click that used to connect both of those metrics to revenue is mostly gone.
That combination is the most dangerous thing a dashboard can do to you. Every number on the page held. The thing those numbers were standing in for did not.
The cost
The research our Futurist Council pulled together in July put hard figures on it. Roughly two-thirds of Google searches now end without a click, and the organic click-through rate on the top result falls by about half when an AI summary sits above it. Meanwhile total query volume is rising and Google's own visits are up year over year.
Read those two facts together and you get the sentence that should worry any operator: the audience did not leave, the traffic did.
Now put yourself in the seat of a business that has quietly run on organic search for years. Nobody there is negligent. They are watching a dashboard that shows impressions holding, rankings holding, position one still position one. Every leading indicator they have ever used says the channel is healthy.
The pipeline is thinning anyway, and it will take them two or three quarters to connect it, because the instrument they would normally use to catch it is the instrument that broke.
That is the expensive part. Not the change itself. The fact that their early-warning system was built on top of the exact relationship that stopped being true.
Why a broken proxy keeps reporting
Almost nothing you track is the thing you actually care about.
You do not care about impressions. You care about qualified conversations. You do not care about utilization. You care about whether the team can absorb another client. You do not care about email open rates. You care about whether anyone is still paying attention.
In every one of those pairs, the number on the left is a stand-in for the thing on the right. It earned its place because a stable relationship connected the two, and for a while that relationship was reliable enough to plan against.
The problem is what happens when the relationship changes. The proxy has no way to detect that. It keeps measuring what it always measured, at the same accuracy, with the same confidence. A thermometer taped to the wrong wall is not broken. It reports a real temperature. It just stopped being the temperature of the room you are standing in.
Your dashboard cannot tell the difference between a number that is healthy and a number that has stopped meaning anything. It only knows the number.
This is the data-rich, decision-ready gap
Most businesses now have more measurement than any operator in history and no more decision quality than they had five years ago. This is why.
Descriptive analytics tells you what happened. It is genuinely good at that. What it cannot do is tell you whether what happened still means what it used to mean, because that question lives outside the data, in the mechanism connecting the metric to the outcome.
Nobody owns that question. It does not appear on a dashboard, it does not have a chart, and it never shows up as a red cell. Being data-enabled means knowing which of your numbers are still load-bearing. Nothing on the screen will tell you that.
The Pressure Test: The Proxy Check
Pick one number you check weekly and would be uncomfortable losing. Run it through these four questions.
1. What outcome is this number standing in for?
Say it plainly. "I track sessions because sessions predict inquiries." "I track utilization because utilization predicts whether we can take more work."
If you cannot finish the sentence, you are not tracking a proxy. You are tracking a habit.
2. What is the mechanism between them?
Not the correlation. The actual causal chain, in steps. Someone searches, sees the listing, clicks, lands, reads, inquires. Write the steps out. Most operators have never done this, and the exercise usually takes ninety seconds and exposes two or three steps nobody has looked at in years.
3. When did you last verify the mechanism instead of the number?
Checking the number is not checking the mechanism. You can watch sessions every Monday for three years and learn nothing about whether sessions still turn into anything.
If the honest answer is that you have never verified it, that is the finding. Move on to question four.
4. If a step in that chain broke tomorrow, where would you see it first?
This is the one that pays. Trace it forward. In most businesses the honest answer is that you would see it first in revenue, which is the slowest and most expensive place to learn anything.
Whatever sits earlier in the chain than the break is your real early-warning line. Start watching that instead, and you have converted a comfortable number into a defensible one.
The close
None of this is an argument against measurement. It is an argument against inheriting your measurements and never reopening them.
A metric will never tell you it stopped mattering. That announcement does not exist. It just keeps reporting, in the same font, in the same green, right up until the quarter where the gap becomes impossible to explain.
Check the number weekly. Check the mechanism quarterly. Trust neither one on its own.
If this is landing, Build Your First Advisor is a free walkthrough at stark-analytics.com/resources. It helps you stand up a single AI advisor around one decision you actually make, and the useful thing about a well-built advisor is that it asks what you have stopped checking.
Originally published in The Decision Brief on LinkedIn.